hckrnws
Related: the 6-set banana Venn diagram – https://www.nature.com/articles/nature11241/figures/4
Still my favorite Venn.
I was in a genetics graduate program when this was published, and this spread like wildfire.
Here's a very rough interactive on more recently published 7-way and 11-way venn: https://observablehq.com/@thadk/venn (with clean-ish svg, cites)
This fork shows an older version with all the shapes turned on and filled with original colors: https://observablehq.com/d/4a5120e490fa9da4
Santiago Ortiz's venn was from 2013 (via archive.org) . I had forgotten I'd seen that, thanks for sharing.
The source has a distinct face-melting vibe. Judging from leftover variables, seems like part of the original plan was to make a 7-way Venn diagram of these broad disciplines: "ART INTERFACE SCIENCE LANGUAGE TECHNOLOGY HUMANISM NETWORKS".
I think the list of resulting combinations is in the code, going from tame concepts like "illustration" and "games", down to gems like "folksonomy", "hypernarrative", "facebook" (??)
Really nice theoretical exercise! For practical visualization, an UpSet plot is a great option: https://upset.app/
TIL! Upset plots are useful and easy to understand.
Required attribution notice too big. Can’t see myself using it.
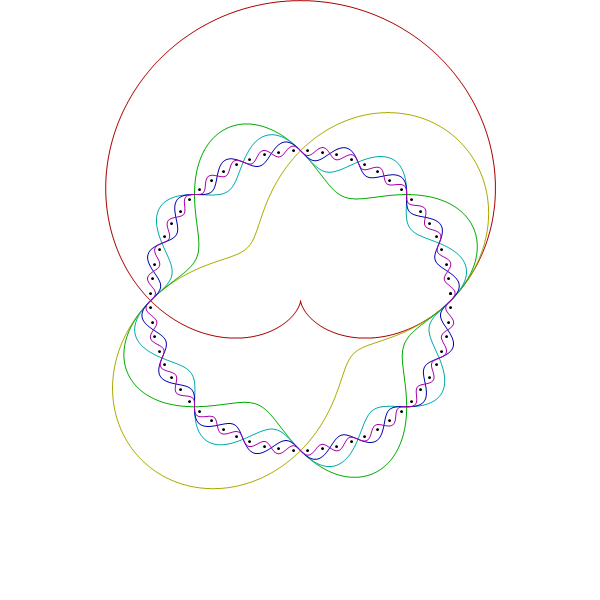
I think this 6 set Venn Diagram is nice because I made it. :)
How did you make this? It is nice. Why does the red line have a heart-shaped bounce/curve in the open white space instead of just being round?
Looks like sinusoids in polar coordinates
I’m wondering what’s the proper way to draw Venn diagrams. I’ve seen that Graphviz has a “nice to have” mention about them, and there are a few simple JS libraries - mostly for two sets. Here’s also my own attempt using an LLM [1].
But maybe someone knows a more general or robust solution - or a better way to achieve this? In the future, I’d like to be able, for example, to find the intersection between two Venn diagrams of three sets each etc.
The nVennR library is pretty robust for multiple sets
the comments here https://news.ycombinator.com/item?id=45742907 have some discussion about projects that take a "focused algorithm for various different diagram types" approach vs graphviz's one size fits all approach. worth checking to see if any of them do venn diagrams.
Please don’t actually use these 5,6,7-way Venn diagrams for anything practical, they’re virtually useless and communicate nothing.
Technically a Venn diagram's entire point is to visualize all possible set relations between N sets. Their "practical" use is explicitly visualizing this.
In popular terminology they are very often confused with Euler Diagrams [0] which represent meaningful relations in sets but not all possible. You shouldn't create Euler Diagrams this complex, but the raison d'etre of Venn diagrams is to visualize the complex nature of set relations.
Agree, I think the linked Upset diagram is better.
Thanks, I was just about to do that!
Can this be configurable? Like 8..9..etc
Beautiful! I want to get this on a t-shirt!
The website isn't working for me (Android Firefox/Chrome).
Nor Firefox Android, even in Desktop mode.
Same for iOS.
Nice! I wonder if there's a mathematical theorem to describe the possible shapes for a 2-d venn diagram of N sets or if there's an N for which it is no longer possible (or maybe it's possible for all N!?). Probably an application of graph theory and Euler's formula to determine feasibility and then something else to figure out the shape constraints. Never thought about it, but an interesting idea.
It is possible for arbitrary N; one construction is called the Edwards-Venn diagram. See https://happyruin.wordpress.com/2013/03/24/edwards-venn-diag...
[dead]
Crafted by Rajat
Source Code